Leaderboard


Popular Content
Showing content with the highest reputation on 12/29/2022 in all areas
-
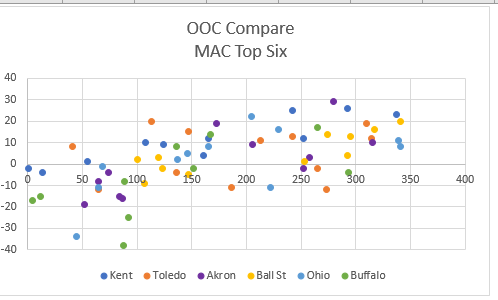
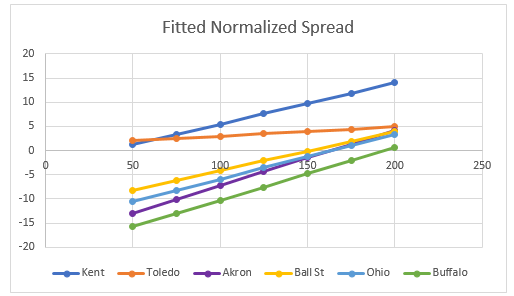
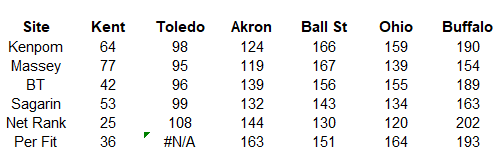
OOC schedules are mostly done from a D1 perspective, only Ohio vs Chicago State, and Buffalo vs Michigan State remain for the top six teams. While I could wait to get one more observation for those two teams - I decided to go ahead and analyze now. Here is a snapshot of normalized margin (i.e subtract 3 points when played at home; add 3 points when played on road) vs rank for the top six teams: It is a little hard with the above chart to get a perspective, so I did a linear fit by team to get a little more clarity: You can think of this as a predicted point spread on a neutral court. For example, if Kent were to play a team ranked 100 on a neutral court, my prediction would be they would be favored by 5 points. Kent has clearly performed the best in OOC play. Toledo is a bit of mixed bag, as they had a good win over UAB (#41), but also a couple of bad losses (UMKC and East Carolina) which contributes to a poor fit and very little differentiation of spreads. The fitted line for UB is consistent with most ranking sites which have UB as sixth best in the MAC at this point. I played with the data a little and made JMU and Tulane 8 point losses to get an idea of how much those poor games hurt ranking. With 8 point losses in those games, UB would have been bunched up with Akron, Ball St and Ohio, ranked closer to 140-150. Finally here is table of some common rankings: The last row would be the ranking indicated by my crude linear fit. Other than Toledo, it is fairly consistent with the other ranks. What I would take from all this - is that Kent is the team to beat, Buffalo will need to play better in MAC than they did in 10 D1 OOC games to date, but I think they will be bunched up with Akron, Ball St. and Ohio and seedings for MAC may depend on how they do against those teams. Finally - my fitted point spread (reminder crude - so I won't be using this to place big wager on game) for the game against Michigan St (~50) would be 19 points.
 1 point
 -
Questionable decision to not have the ball in the hands of your starting QB for the last 2-Pt try. What a game this turned out to be though.1 point
-
All that matters is UB Bulls are Camellia Bowl champions. Forget transfer portal, forget about Maurice Linquist might leave eventually. My main concern with UB football is if UB didn’t bowl this season again it would bring potential disaster for UB football. In today’s transfer portal environment even in the MAC you can’t be a losing football team. If the UB Bulls football team hypothetically had another losing football team again with transfer portals it would be a potential disaster. UB football like in the 2000’s players see that and the other MAC schools use that against UB when recruiting. Some of us remember those dark days you don’t want UB football to ever go back to that regardless of the who the coach is or who is transferring. UB football needs to keep the winning train going because most players don’t like 1-11 or 2-10 football teams regardless of a few misguide people that think that isn’t so bad it is worse today because of the transfer portal. It’s bad and it is hard to climb out of that losing hole even harder today with the transfer portal. Trust me I have seen the UB football team at rock bottom and it didn’t feel good going 0-11 sure someone will come to UB but it was players and coaches that couldn’t chew bubble gum and catch a football at the same time. UB football needs to always bowl it is very important with .500 record gets you to a bowl today. Look at Kent State football there football program is a mess a head coach resigns to become a offensive coordinator for Deion Sanders Colorado Buffaloes that is what I am talking about. I want to be the first to predict Kent State football will be in last in the MAC East in 2023. UB Bulls doesn’t want any part of that especially in Buffalo. UB football would never live that down what happened at Kent State some people in Buffalo would calling to shut the football program down. Winning is very important especially at UB. My posts are never personal most of the coaches and players I sure are good people but sports it is winning and losing there is no door number 3 like the game show “Let’s Make a Deal “. I try to post the reality of situations we need to win I don’t know any of these people personally at UB at all. I am just a Buffalo sports fan that saw a 17 year playoff drought for the Buffalo Bills and am currently watching a Buffalo Sabres team that currently has a 11 year playoffs drought. When you lose there are consequences for that players and coaches don’t want to come for a loser. Sure we got players and coaches for those Bills and Sabres teams the wrong coaches Dick Juron, Rex Ryan. Doug Marrone resigned on his own after one season wanting out that is what losing did for the Buffalo Bills during the 17 year drought. The Buffalo Sabres tried to trade for a back up goalie Matt Murray this offseason. Matt Murray had no trade to Buffalo Sabres clauses coming from Ottawa Senators for crying out loud. Matt Murray that bum he refused to come here canceling a trade this offseason. So losing isn’t good for a long periods of time. I am thrilled UB football avoided this. UB football will get enough quality players to bowl again next season after winning a bowl yesterday so I am very happy and trilled UB football are bowl champions again avoiding potential disaster if UB didn’t bowl this season. Now UB builds the performance center and look forward to next season in 2023 in my opinion. UB Horns Up! Go Bulls! Let’s Go Buffalo1 point